Current price
Compared to the previous day’s close
Compared to the beginning of the year
Commodity
Brent (dollar/barrel)
81.64
1.45
- 1.82
WTI (dollar/barrel)
76.55
1.50
- 1.85
Gold (dollar/ounce)
2,065.00
30.10
234.90
Indices
Dow-Jones
35,416.98
83.51
2,269.73
S&P 500
4,554.89
4.46
715.39
Nasdaq
14,281.76
40.74
3,815.28
Nikkei
33,435.09
80.27
7,340.59
Dax
15,992.67
26.30
2,069.08
FTSE 100
7,455.24
- 5.46
3.50
CAC 40 INDEX
7,250.13
- 15.36
776.37
ShanghaiComposite
3,030.39
- 4.41
- 58.87
BIST 100
8,093.54
- 13.65
2 584.38
RTS
1,128.61
- 3.44
187.26
Currency
USD/EUR
1.0998
0.0000
0.0300
GBP/USD
1.2708
0.0100
0.0600
USD/JPY
147.2400
- 0.9700
16.1200
USD/RUB
88.9005
- 0.1700
15.1500
USD/TRY
28.9167
- 0.0100
10.2300
USD/CNY
7.1250
- 0.0300
0.2400
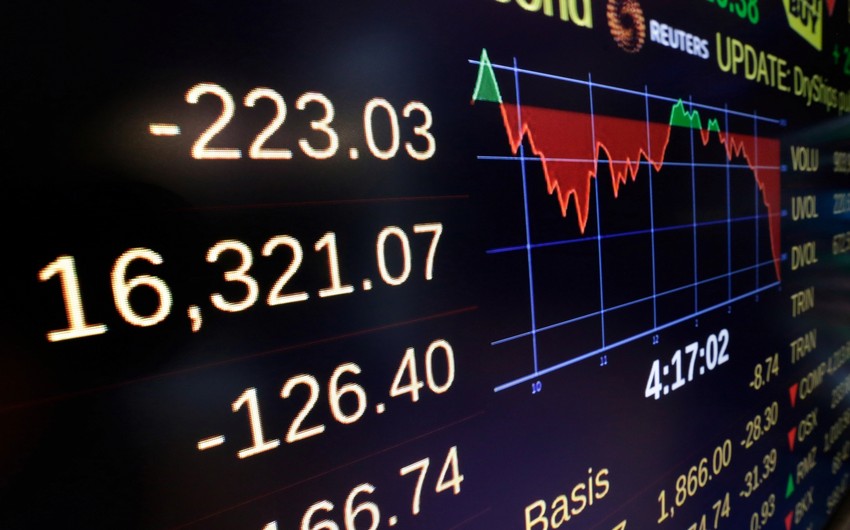
Key indicators of world commodity, stock, and currency markets (29.11.2023)
- Economy
- 06:44 29.11.2023
- Read: 309
Açar sözlər:
Paylaş:
Economy
Azerbaijani oil price exceeds $70
15:36 07.02.2026Azerbaijani oil price declines in global markets
10:50 06.02.2026Gold price decreased by nearly $49 on global market
11:03 05.02.2026Oil prices drop in global markets
11:02 05.02.2026Gold price increased by more than $141 on global market
11:28 04.02.2026-
- 19:32 08.02.2026
-
- 19:31 08.02.2026
-
- 19:29 08.02.2026
-
- 19:24 08.02.2026
-
- 19:23 08.02.2026
-
- 19:22 08.02.2026
-
- 19:21 08.02.2026
-
- 19:20 08.02.2026
-
- 19:19 08.02.2026
-
- 23:39 07.02.2026
-
- 15:36 07.02.2026
-
- 15:34 07.02.2026
-
- 15:31 07.02.2026
-
- 21:12 06.02.2026
-
- 21:10 06.02.2026
-
- 21:09 06.02.2026
-
- 21:08 06.02.2026
-
- 21:06 06.02.2026
-
- 15:29 06.02.2026
-
- 15:12 06.02.2026
-
- 14:32 06.02.2026
-
- 14:31 06.02.2026
-
- 12:25 06.02.2026
-
- 12:25 06.02.2026
-
- 11:04 06.02.2026
-
- 10:50 06.02.2026
-
- 10:13 06.02.2026
-
- 10:12 06.02.2026
-
- 10:11 06.02.2026
-
- 10:11 06.02.2026
-
- 10:09 06.02.2026
-
- 15:40 05.02.2026
-
- 15:37 05.02.2026
-
- 15:08 05.02.2026
-
- 14:58 05.02.2026
-
- 14:57 05.02.2026
-
- 12:08 05.02.2026
-
- 11:03 05.02.2026
-
- 11:02 05.02.2026
-
- 10:54 05.02.2026


