Current price
Compared to the previous day’s close
Compared to the beginning of the year
Commodity
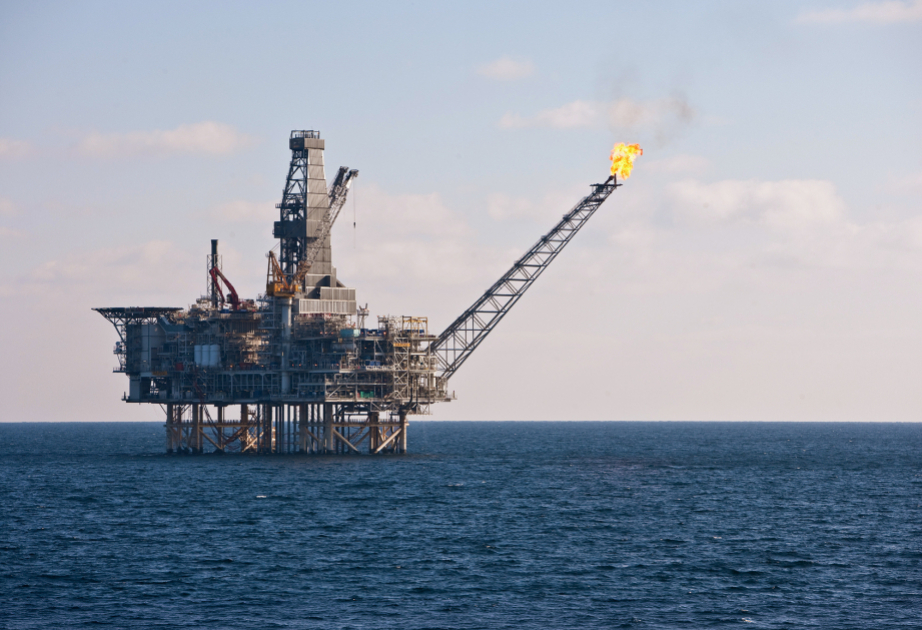
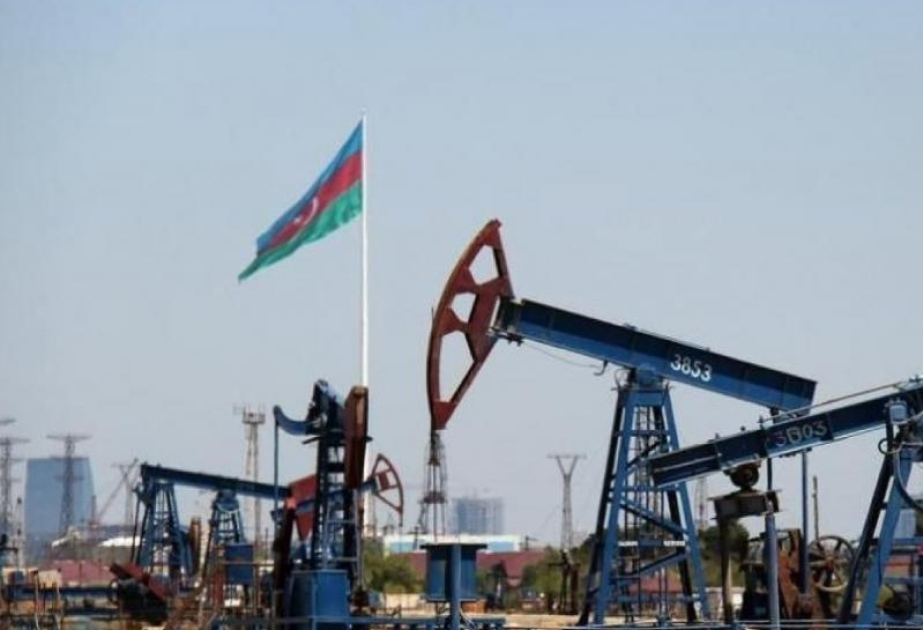
Brent (dollar/barrel)
76.87
- 0.11
- 6.59
WTI (dollar/barrel)
71.79
- 0.13
- 6.61
Gold (dollar/ounce)
2,036.10
- 14.70
206.00
Indices
Dow-Jones
37,305.16
56.81
4,157.91
S&P 500
4,719.19
- 0.36
879.69
Nasdaq
14,813.92
52.36
4,347.44
Nikkei
32,697.82
- 346.91
6,603.32
Dax
16,751.44
- 0.79
2,827.85
FTSE 100
7,576.36
- 72.62
124.62
CAC 40 INDEX
7,596.91
21.06
1,123.15
ShanghaiComposite
2,938.79
- 29.70
- 150.47
BIST 100
7,993.85
180.45
2,484.69
RTS
1,060.64
5.19
119.29
Currency
USD/EUR
1.0910
- 0.0100
0.0200
GBP/USD
1.2691
- 0.0100
0.0600
USD/JPY
142.2800
0.4100
11.1600
USD/RUB
90.3069
0.8200
16.5600
USD/TRY
28.9962
- 0.0200
10.3100
USD/CNY
7.1294
0.0200
0.2400
Key indicators of world commodity, stock, and currency markets (18.12.2023)

Economy