Current price
Compared to the previous day’s close
Compared to the beginning of the year
Commodity
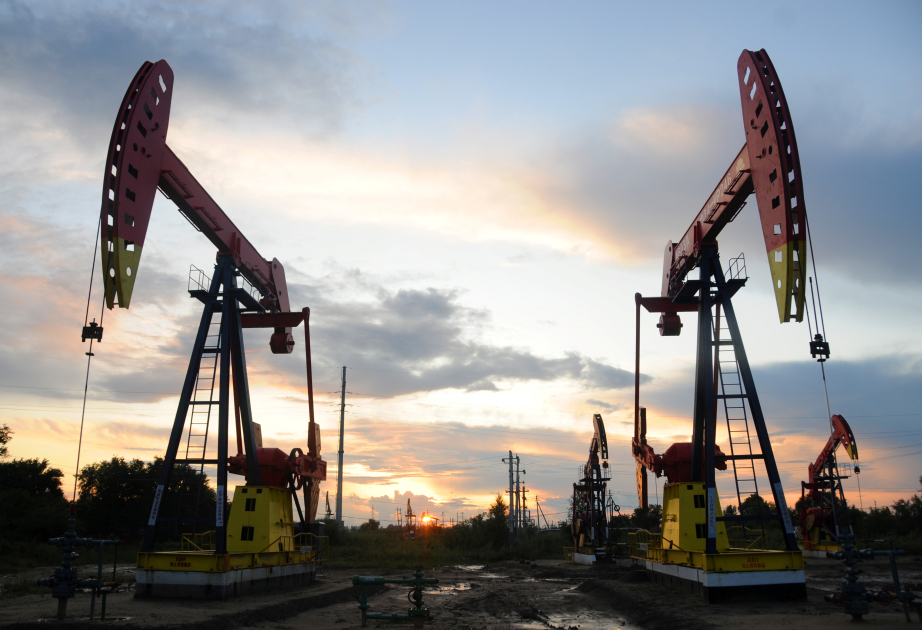
Brent (dollar/barrel)
73.06
- 2.97
- 10.40
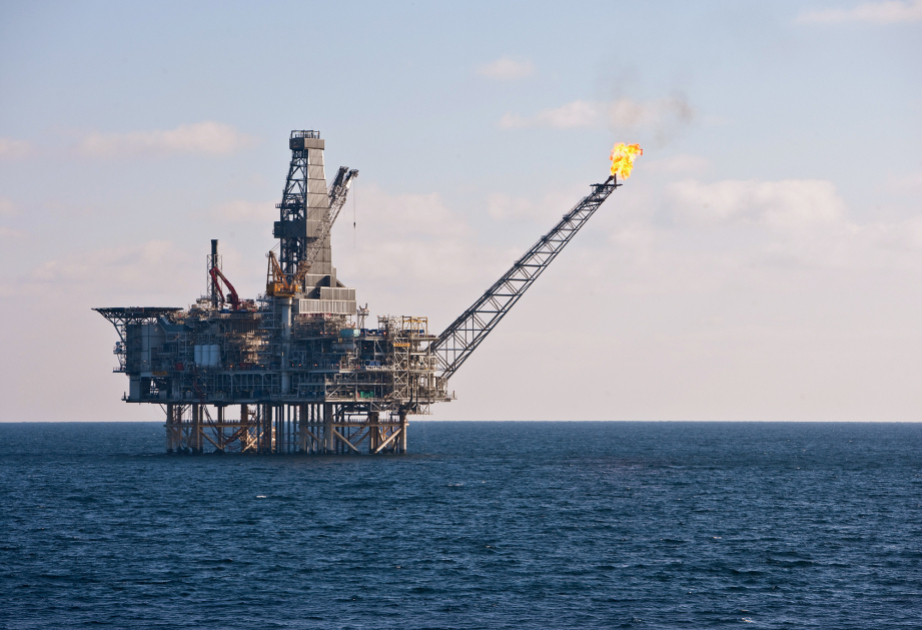
WTI (dollar/barrel)
68.45
- 2.87
- 9.95
Gold (dollar/ounce)
1,994.40
0.70
164.30
Indices
Dow-Jones
36,577.94
173.01
3,430.69
S&P 500
4,643.70
21.26
804.20
Nasdaq
14,533.40
100.91
4,066.92
Nikkei
32,887.98
96.18
6,793.48
Dax
16,791.74
- 2.69
2,868.15
FTSE 100
7,542.77
- 2.12
91.03
CAC 40 INDEX
7,543.55
- 7.98
1,069.79
Shanghai Composite
2,989.15
- 2.29
- 100.11
Bist 100
7,748.85
20.41
2,239.69
RTS
1,056.02
8.07
114.67
Currency
USD/EUR
1.0788
0.0000
0.0100
USD/GBP
1.2549
0.0000
0.0500
JPY/USD
145.6800
- 0.4800
14.5600
RUB/USD
90.2730
- 0.7200
16.5200
TRY/USD
29.0489
0.0600
10.3600
CNY/USD
7.1828
0.0100
0.2900
Key indicators of world commodity, stock, and currency markets (13.12.2023)


Economy